Read MoreLess
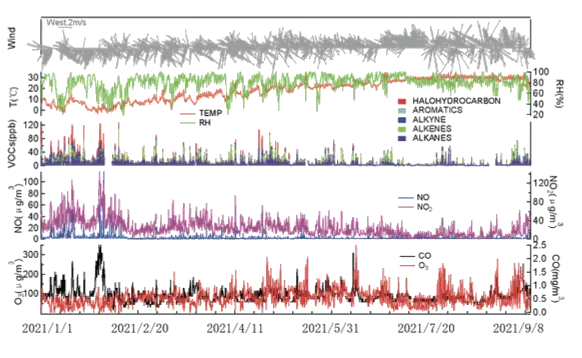
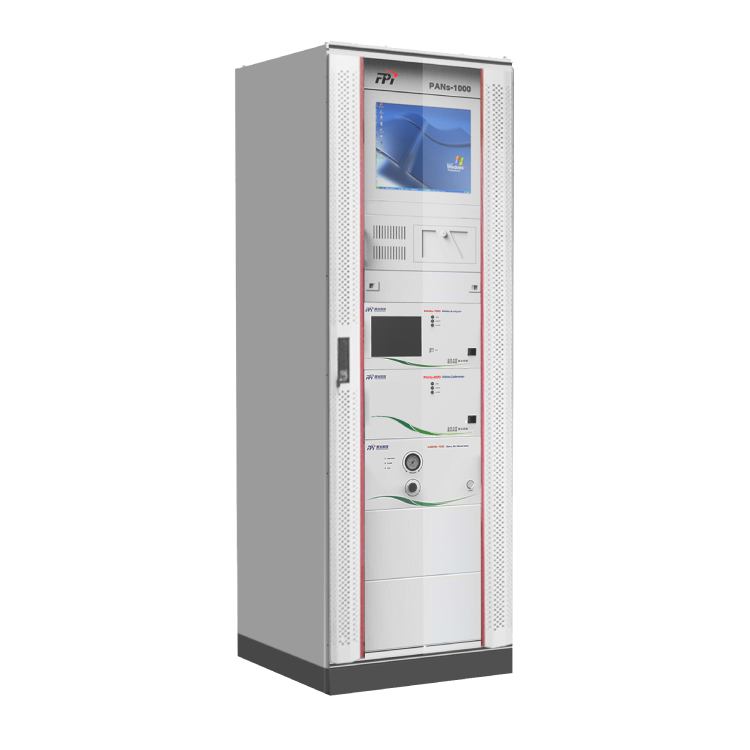
PANs monitors O3/NOx in Los Angeles, linking 45% peaks to traffic, reducing alerts by 18% with emission controls.

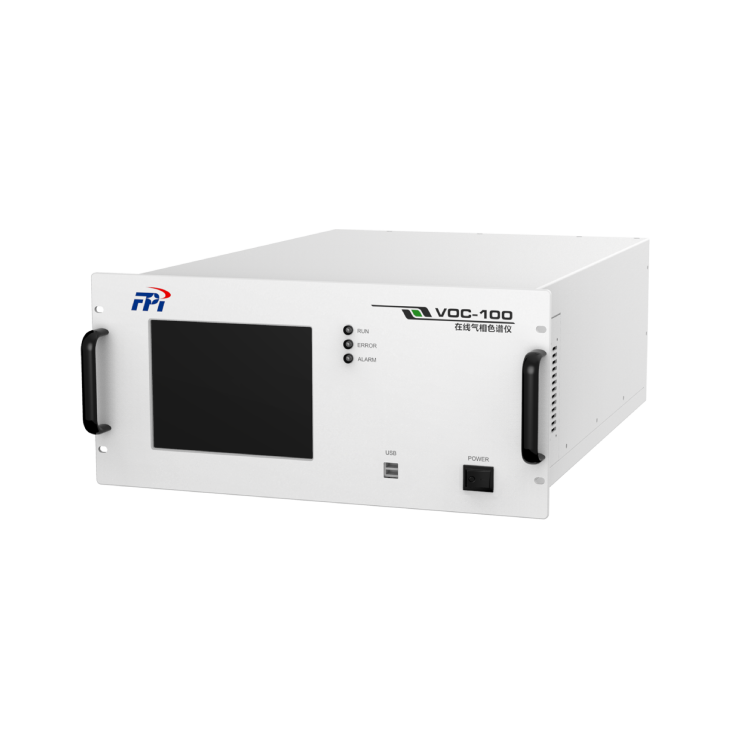
PID traces VOCs from Houston refineries, cutting benzene by 25% to meet EPA Method TO-15.
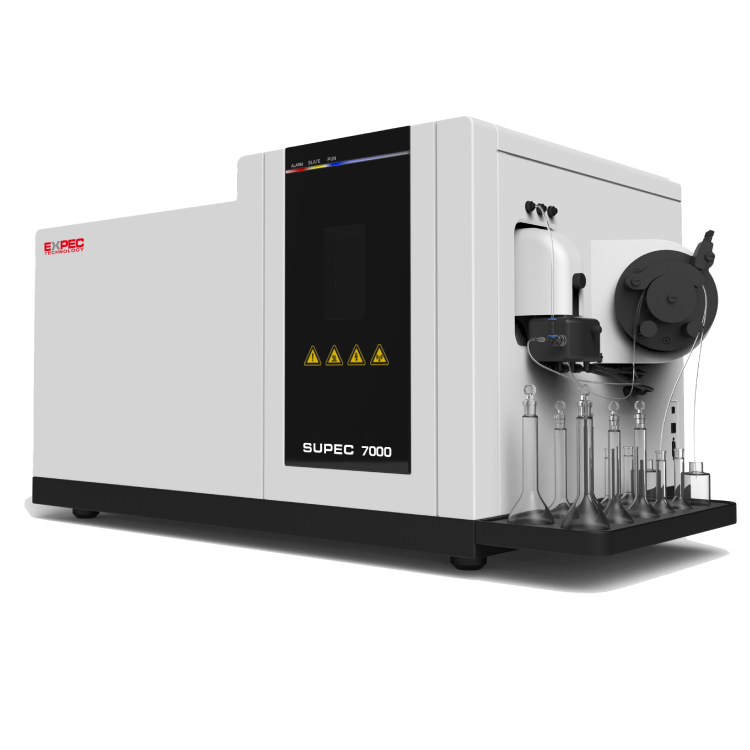
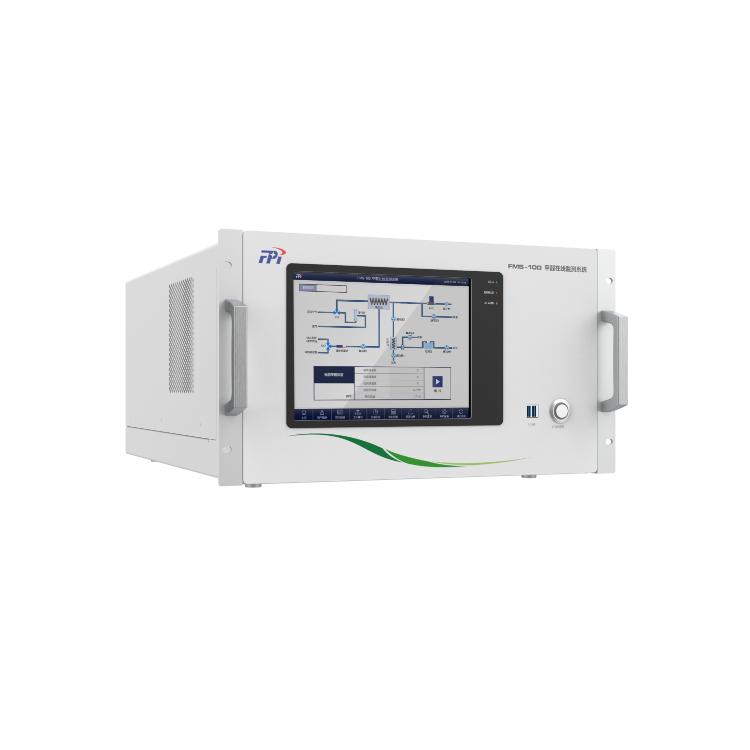
EXPEC-2000’s CO/NOx data in Beijing refines models, lowering summer exceedances by 15%.
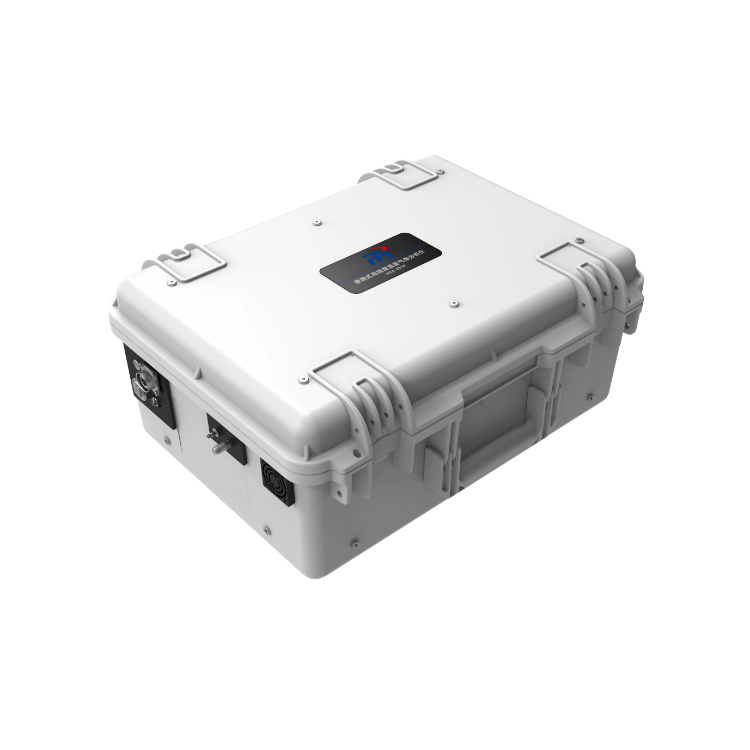
Portable AQMS-600 maps VOCs in Delhi, empowering apps for 20% higher compliance reporting.
FPI’s systems streamline precursor monitoring.
- Ambient Sampling: Multi-inlet manifolds capture O3/NOx/VOCs, filtered for particulates.
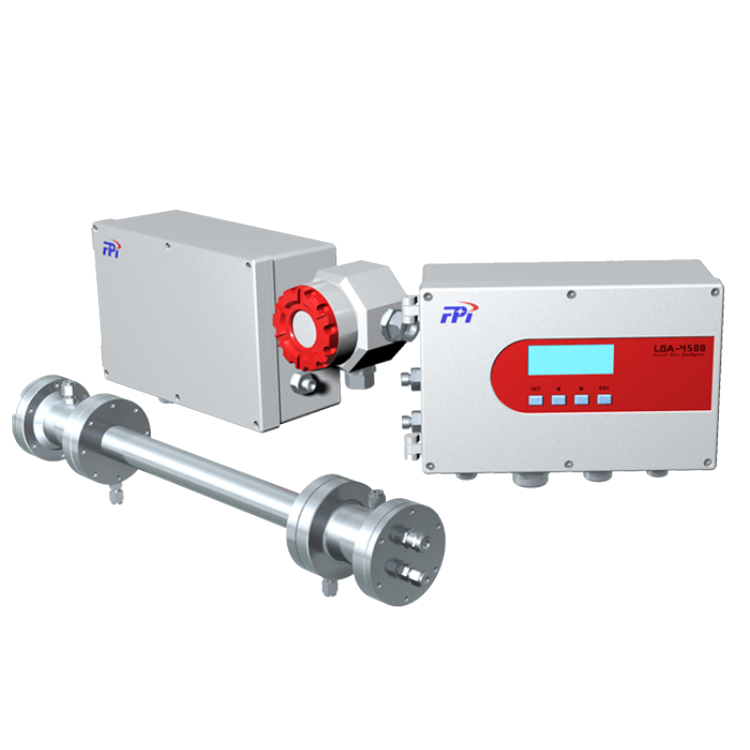
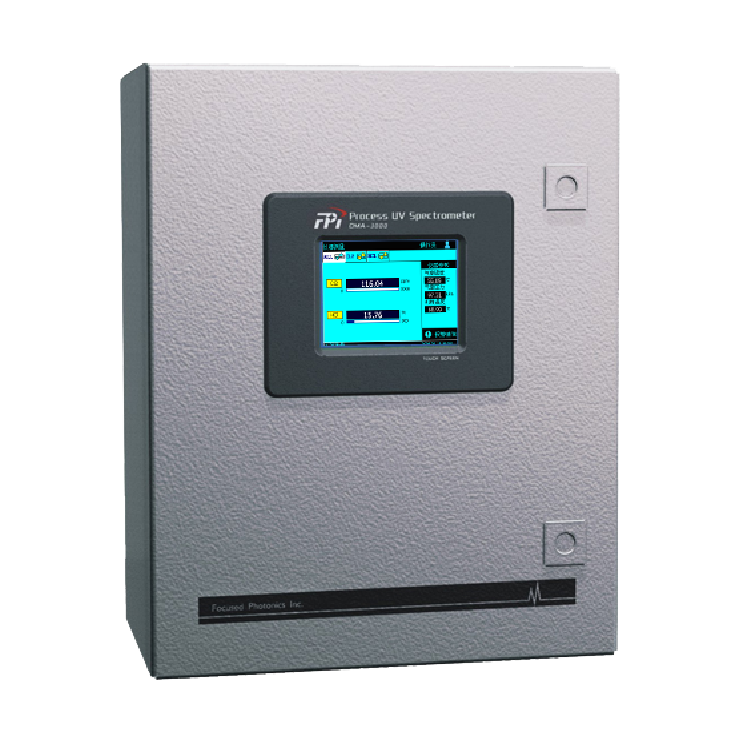
- Spectral Quantification: UV DOAS/PID/NDIR modules measure concentrations, cross-verified for accuracy.
- Data Modeling: AI analyzes NOx/VOC ratios, forecasting O3 formation with 85% precision.
- Alert Generation: Cloud dashboards and SMS notify exceedances for rapid response.
This process, mapped in schematics, ensures timely smog insights.
Photochemical Pollution Technologies Table
Comprehensive monitoring to capture pollution processes
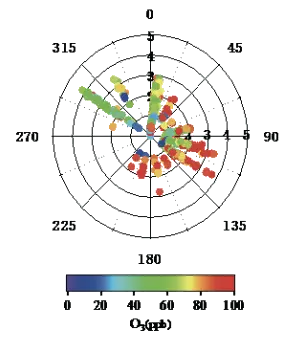
Quantify the local and transported contributions of O₃ to support joint prevention and control
Identify ozone formation control zones and develop optimal reduction strategies
Rank ozone formation potential to identify key VOC components
Analyze VOC sources to formulate refined control measures
| Technology | Pollutants | Sensitivity | Deployment | FPI Advantage |
|---|---|---|---|---|
| UV DOAS | O3, NO2, SO2 | 0.5 ppb | Urban grids | Interference-free spectra |
| PID | VOCs (benzene) | 1 ppb | Industrial sites | Humidity-corrected ionization |
| NDIR | CO, precursors | 10 ppb | Regional networks | Dual-beam stability |
| AI Modeling | O3 Formation | 85% Accuracy | All sites | NOx/VOC ratio prediction |
FPI’s suite addresses 2025’s photochemical demands.